
Industry
How to Read China Vehicle Export Data: Shipments, Destinations, and Overseas Sales
A practical guide to interpreting China vehicle export data, from customs shipments and automaker dispatches to registrations and retail demand.
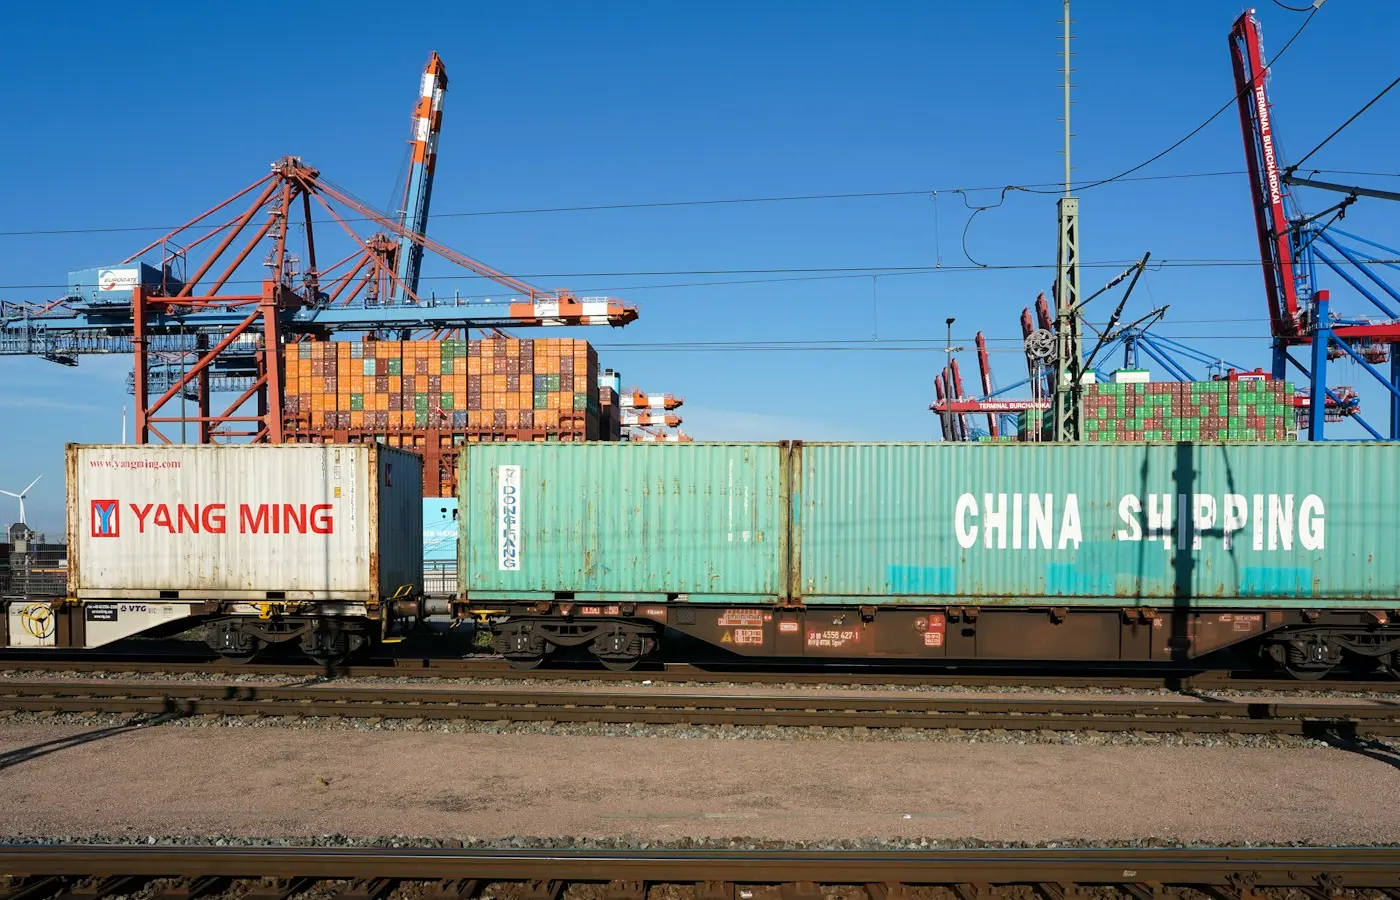
A headline saying China exported a certain number of vehicles can be useful—but it does not automatically tell you how many cars were bought by overseas consumers.
The key question is simple: at what point in the vehicle journey was the number counted? A vehicle can be cleared for export in China, shipped to a distributor, arrive at a foreign port, enter dealer inventory, be registered for road use, and finally be delivered to an end customer. Each stage can produce a legitimate data point. None should be treated as interchangeable with the others.
For international buyers, fleet operators, suppliers, and analysts, this distinction matters. Export statistics can reveal changes in China-built vehicle production, logistics flows, and overseas channel expansion. Registration and retail data are more relevant when assessing demand in a particular market. Company-reported overseas deliveries may sit somewhere between the two, depending on how the manufacturer defines them.
Start with the question the export figure actually answers
Before comparing two export figures, identify the measurement point. Most confusion comes from using a shipment number to answer a sales question.
A practical framework has four stages:
- Customs export clearance — a vehicle is declared as exported from China under the relevant trade classification.
- Manufacturer or industry shipment reporting — an automaker, industry association, or reporting body records a vehicle as exported or dispatched.
- Arrival and wholesale distribution — the vehicle reaches a destination market, importer, distributor, dealer group, fleet customer, or storage location.
- Registration or retail delivery — the vehicle is registered for use, sold to a retail customer, delivered to a fleet, or otherwise enters service.
These events can occur in different months, quarters, or even calendar years. A surge in customs exports may reflect strong overseas retail demand, but it may also reflect a distributor building stock before a new model launch, a change in shipping schedules, or a large fleet order that will be registered later.
When reading any China vehicle export dataset, check five basics before drawing conclusions:
- Source: Is the number from customs, an industry association, an automaker, or a destination-market registration authority?
- Vehicle scope: Does it cover all vehicles, passenger vehicles, commercial vehicles, or a narrower product group?
- Unit definition: Are the figures for complete vehicles only, or can they include chassis, semi-knocked-down kits, or completely knocked-down kits?
- Geography: Does the destination mean the first country of import, the final retail market, or a regional grouping?
- Time basis: Is the figure monthly, year-to-date, calendar-year, or based on a company reporting period?
Without those details, two apparently conflicting reports may simply be measuring different points in the same supply chain.
What Chinese customs and industry export statistics usually measure
China’s vehicle export story is commonly described using two broad data families: customs trade data and industry shipment data.
Customs data tracks cross-border trade flows
Customs statistics are designed to record goods moving across a border under specified commodity classifications. For vehicles, the classification matters greatly. A broad automotive category can include products that are not directly comparable with passenger-car sales, while some classifications may explicitly include kits or non-complete vehicles.
For market-wide analysis, customs data is especially useful for questions such as:
- How many China-origin vehicles were exported during a period?
- Which declared partner countries received those shipments?
- How did vehicle exports change relative to other goods categories?
- Is trade activity rising or falling across specific regions?
But customs data is not designed as a direct measure of retail demand. It generally records a trade event, not the moment when an overseas driver, fleet, or business puts a vehicle into use.
Industry association data is also shipment-oriented
The China Association of Automobile Manufacturers (CAAM) publishes widely cited monthly and cumulative export figures. Its releases can be valuable because they separate major vehicle categories, including passenger vehicles, commercial vehicles, conventional-fuel vehicles, and new-energy vehicles.
For example, CAAM reported that China exported 4.312 million vehicles in the first nine months of 2024, including 3.633 million passenger vehicles and 679,000 commercial vehicles. In September 2024 alone, it reported 539,000 vehicle exports, including 457,000 passenger vehicles. The figures were published in CAAM’s September export summary, available through its statistics information service.
These figures demonstrate why category discipline matters. A total vehicle-export number includes commercial vehicles, which may follow different markets, ordering cycles, logistics patterns, and regulatory requirements than passenger cars. A passenger-vehicle export figure is usually the more appropriate starting point for readers assessing overseas passenger-car expansion.
The same applies to powertrain categories. CAAM reported 928,000 new-energy vehicle exports for January through September 2024, but “new-energy vehicle” should not automatically be read as “battery-electric vehicle.” The category can include more than one propulsion type. A reader looking specifically for battery-electric or plug-in hybrid export volumes should use a source that separates those categories explicitly.
Official summaries of earlier CAAM data also show the importance of dating every claim. China exported 3.111 million vehicles in 2022, according to a National Development and Reform Commission notice reproducing CAAM statistics. That is useful historical context, not evidence of current conditions.
Why customs and industry figures may not match exactly
Customs and industry-association series can both be credible while producing different totals. They can differ because of reporting cut-off dates, company reporting practices, vehicle classifications, treatment of certain vehicle forms, and the stage at which a shipment is recorded.
Without a directly comparable methodology note for a particular release, it is safer not to assign a precise reason for a gap between the two series. The practical rule is to avoid combining them into one trend line unless their definitions, time periods, and vehicle scope have been checked.
Why passenger-vehicle export numbers do not equal overseas retail sales
A passenger vehicle recorded as exported has left, or been recorded as leaving, the Chinese market. That does not establish that it has been sold to an overseas end user.
The intervening steps can be substantial:
- A manufacturer allocates vehicles to an overseas importer or distributor.
- Vehicles move to a Chinese port and are declared for export or recorded in an industry export series.
- Shipping and port handling take place.
- Vehicles enter a foreign market, bonded zone, storage compound, distributor inventory, or dealer network.
- A vehicle may be registered by a dealer, leasing company, fleet operator, rental provider, or private buyer.
- The vehicle may then be delivered to its final user.
Not every destination dataset measures the final step either. New-registration data is generally closer to market entry than customs figures, but its methodology can vary. A registration series may include retail purchases, fleet vehicles, dealer demonstrators, rental vehicles, or company cars. Some markets also report registrations by brand or model but do not publish a directly comparable retail-sales measure.
This does not make export data less valuable. It means the data answers a different question.
- Exports can indicate: manufacturing output allocated to overseas channels, logistics demand, importer activity, and the geographic expansion of supply.
- Registrations can indicate: vehicles entering legal use in a destination market, subject to the definitions of the local registration authority.
- Retail deliveries can indicate: end-user handovers, if a company or market body publishes a clear retail methodology.
A sharp rise in exports followed by rising registrations can support an interpretation of expanding local market presence. A rise in exports without a matching rise in registrations is not proof of weak demand, but it is a reason to investigate timing, inventory, fleet channels, product mix, and country-specific reporting definitions.
How to read destination rankings without overinterpreting them
A country that ranks highly in China’s export data is not necessarily the country where all of those vehicles will ultimately be registered.
The customs destination may be the first declared trade partner, a regional distribution point, or the country where an importer takes title to a shipment. It may or may not be the final market where the vehicles are sold and used.
This is particularly important when reading lists of “top export destinations.” A destination ranking can show the direction of declared trade flows, but it cannot independently establish:
- final consumer demand in that country;
- local market share by brand or model;
- dealer inventory levels;
- re-export activity;
- the number of vehicles registered for road use;
- profitability of the local business.
Regional reporting adds another layer of complexity. Some industry releases group destinations into regions rather than reporting individual countries, while customs data may use country-level partner definitions. A region with rising reported exports may contain markets with very different regulatory environments, vehicle preferences, and registration performance.
For a country-specific assessment, use two complementary sources where available:
- China-origin trade data showing vehicle flows to the declared destination.
- Local registration, licensing, or national automotive-association data showing vehicles entering that market.
The comparison should be treated as directional unless both sources use matching vehicle categories and reporting periods.
A practical method for comparing China vehicle export data
A disciplined comparison does not require a complex model. It requires a consistent checklist.
| Check | Why it matters | Example of a mismatch to avoid |
|---|---|---|
| Vehicle category | Passenger and commercial vehicles have different demand patterns | Comparing all-vehicle exports with passenger-car registrations |
| Powertrain definition | “New energy” may cover more than battery-electric vehicles | Treating NEV exports as BEV exports without a category split |
| Measurement point | Shipment, registration, and retail delivery are different events | Calling customs exports overseas sales |
| Reporting period | Shipping and registration timing can cross months or quarters | Comparing September exports with August registrations |
| Destination definition | First import destination may differ from final market | Assuming a customs partner country is the end-user market |
| Data status | Monthly series can be revised or updated | Mixing a preliminary monthly release with final annual data |
| Source methodology | Company and government datasets may use different coverage | Adding automaker overseas deliveries to customs exports |
A useful comparison sequence
For analysts evaluating Chinese passenger-vehicle demand in a specific overseas country, the following sequence is usually more reliable than starting with a headline export total:
- Identify the destination market and the relevant passenger-vehicle category.
- Find local new-registration or market-sales data and read its methodology.
- Review China-origin export data for the same broad period and vehicle scope.
- Check company disclosures for definitions of overseas sales, wholesales, exports, or deliveries.
- Compare trends over several reporting periods rather than relying on a single month.
- Treat any gap as a question for further analysis, not as evidence of unsold stock or failed demand.
This approach is particularly important for fleet buyers and suppliers. A market can show rising imported-vehicle flows before a local service network, parts pipeline, dealer footprint, or used-vehicle ecosystem has matured. Export volume alone does not answer those operational questions.
What export data can—and cannot—tell buyers, suppliers, and analysts
China vehicle export data is a useful leading indicator of cross-border activity. It can help identify which segments are expanding, where manufacturers are directing supply, and whether overseas distribution is becoming more important to China-built vehicle production.
For suppliers, export growth can signal potential demand for shipping capacity, parts support, homologation services, repair equipment, and regional warehousing. For fleet operators, it can indicate a widening model pipeline, but it does not by itself establish local parts availability, repair lead times, residual values, or regulatory suitability.
For investors and market researchers, passenger-vehicle export figures can show the scale of outbound shipments. They cannot alone prove durable demand, pricing power, dealer profitability, customer satisfaction, or long-term market share.
The most defensible interpretation uses each dataset for the question it was built to answer:
- Use customs and industry export statistics to assess China-origin shipment flows.
- Use destination-market registrations to assess vehicles entering service locally.
- Use retail or delivery disclosures to assess end-user handovers, where the methodology is clear.
- Use financial and operational disclosures to assess profitability, inventory exposure, dealer development, and aftersales capability.
The headline number matters. The definition behind it matters more.
FAQ
What is the difference between China customs vehicle exports and automaker export shipments?
Customs data records cross-border trade declarations under customs classifications. Automaker or industry export figures are generally based on manufacturer reporting or industry compilation. Both are shipment-oriented measures, but their coverage, timing, and classification rules may differ. They should not be assumed to match unit for unit without checking methodology.
Do Chinese vehicle export figures show how many cars were sold overseas?
No. Export figures normally show vehicles shipped, dispatched, or declared for export. They do not directly show how many vehicles were sold to retail buyers overseas. Destination-market registrations or clearly defined retail-delivery data are more relevant for that question.
Why can a country rank highly as an export destination but show fewer local registrations?
The customs destination may reflect where vehicles were imported, distributed, stored, or processed in trade channels rather than the final country of use. Timing differences and mismatched vehicle categories can also affect comparisons. A country ranking in shipment data should therefore be checked against local registration data before being interpreted as end-market demand.
Which data should I use to assess Chinese passenger-car demand in a specific overseas market?
Start with the destination country’s new passenger-vehicle registration data or a national industry association’s market-sales series, after checking its methodology. Then use China-origin export data and automaker disclosures as supporting indicators of supply, channel activity, and timing.